Line chart
Create line charts from your data
|
|||||
|
|
||||
|
|
||||
|
|
||||
|
|
||||
|
|
||||

The Line chart building block helps you to create line charts from your data which you may embed in your documents.
Use cases
- Illustrate your data by using a line chart diagram
Configuration
Reload
Click on the reload icon to scan the Google Form for modified, added or removed fields.
Create form
After adding the script to your flow, click on the keyboard icon in the input parameter section.
Only unbound input parameters are activated in the form. if you are using building blocks with the same input parameters multiple times, you may want to activate the input fields in the form by editing the form settings.
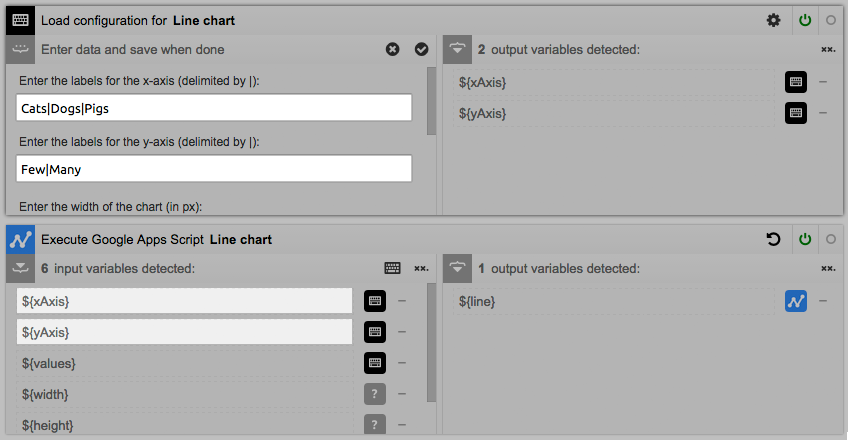
After adding the form you can enter the values to be displayed in your chart into the text boxes.
Please make sure to use the syntax that is described in the placeholder in the text boxes. For example the values to be used in the chart have to be delimited by a comma.
You can either enter fixed values or you can use variables to generate your charts from data coming from a Google Sheet, your contacts or any other data source.
Useful combinations
If you for example have a list variable called items.quantity that holds a number of values that you want to visualize in your chart, you can use the loop with separators like this:
${foreach items item ,}${item.quantity}${end}
If you want to create a list separated by the pipe symbol |, you can use a statement like this:
${foreach items item |}${item.name}${end}
Questions and Feedback
If you have any comments on this page, feel free to add suggestions right to the Google document that we are using to create this site.
If you are not yet member of the Ultradox community on Google+, please join now to get updates from our end or to provide feedback, bug reports or discuss with other users.
Last Updated: 1/15/18